Hobbyist. Unorthodox cryptocurrency analysis, tools, visualization.
Focus: communication, understanding, adoption. Pluralist. BTC, ETH, ...
Note: The following tools are in hibernation for now. With resources and time later this summer, I may release refurbished versions. Feel free to hit me up on if you have any comments or questions.
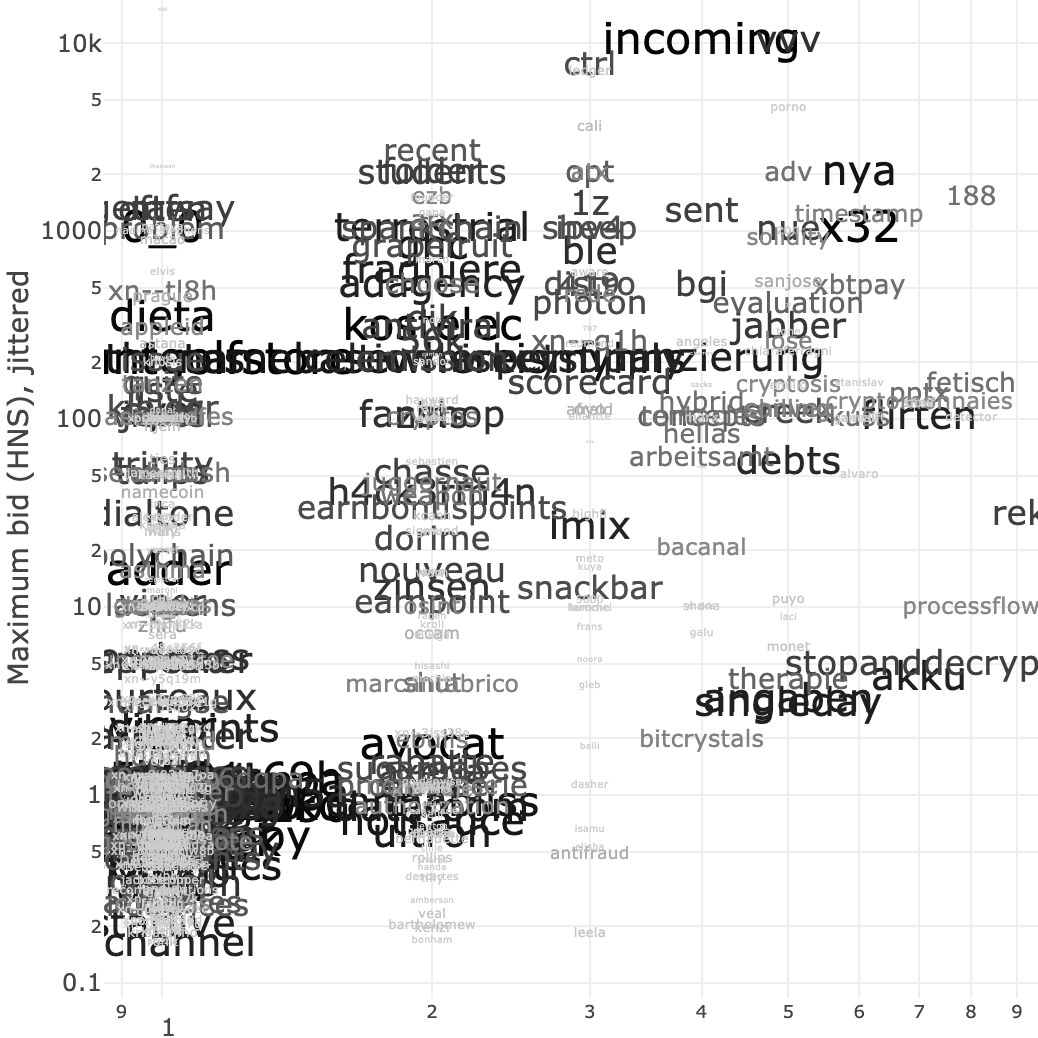
Using great data from HNScan, browse recent bidding action on HNS, the possible future of the internet's DNS. Plot shows number of bids by maximum bid amount on an often surprisingly orderly log-log plot.
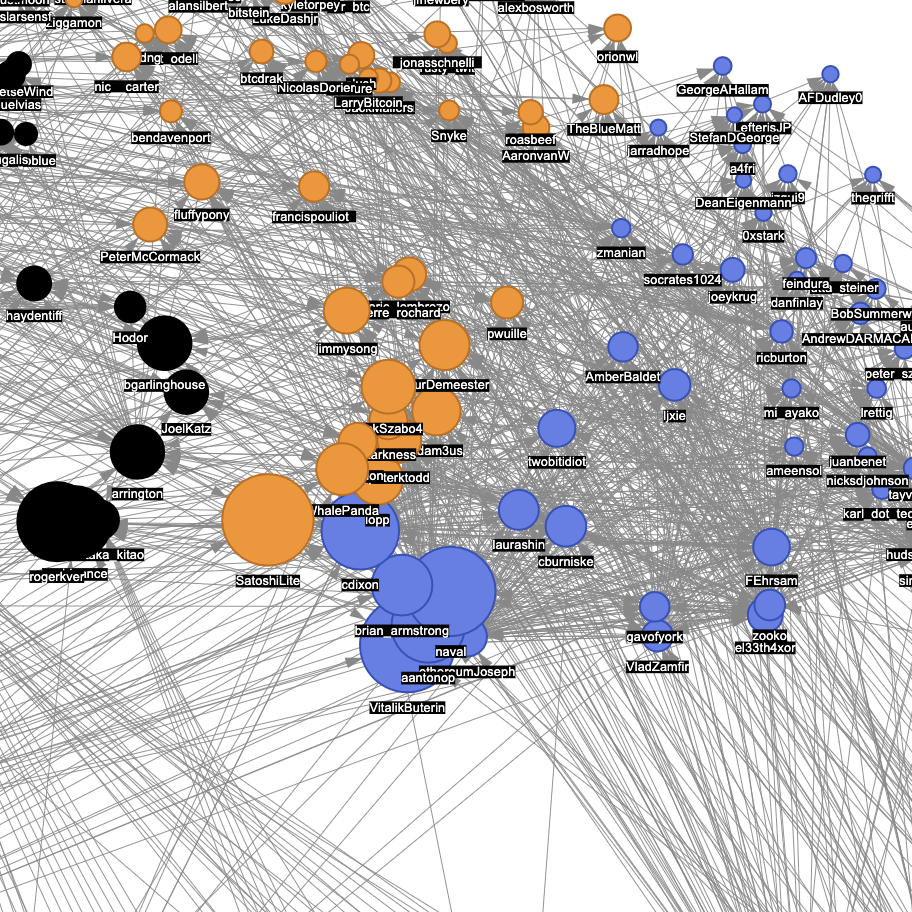
"Top" 50 accounts for BTC, ETH, and XRP selected algorithmically by hive.one then interconnected into a network of following/followers. A map of the "space," at least on Twitter, but a tool to see who follows whom, and perhaps some new pointers for folks to follow.
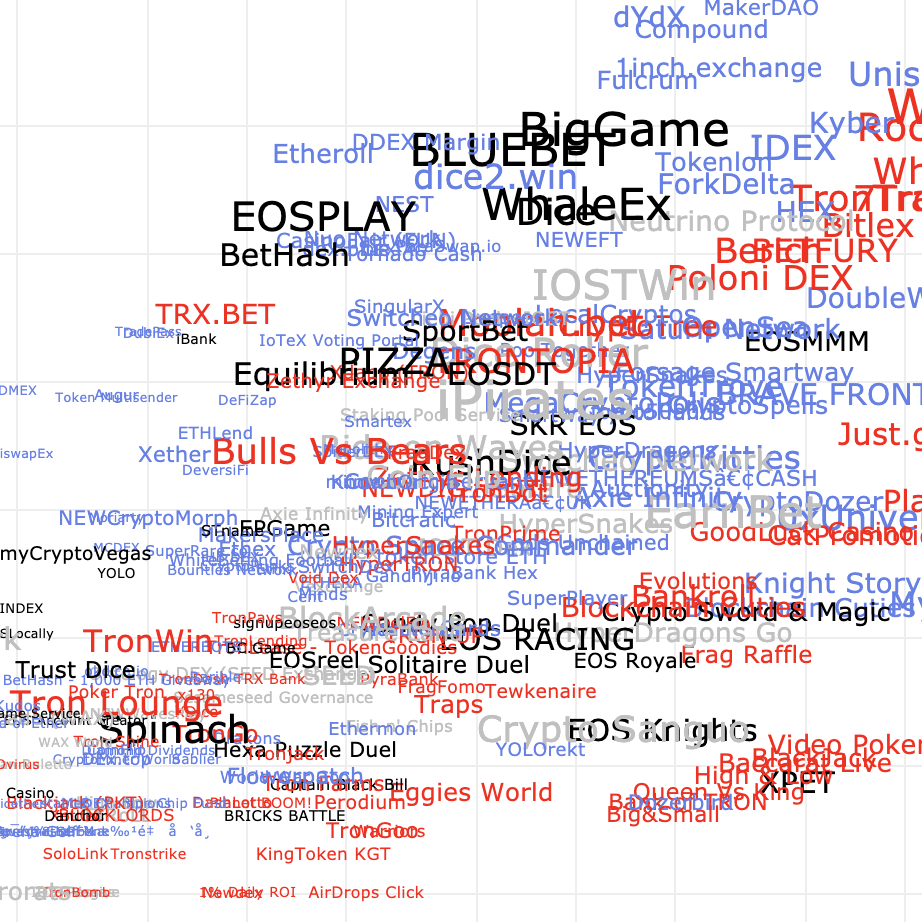
Tool to explore various metrics of Dapps across major smart contract platforms. Filter, zoom, click, etc. Data from great DappRadar.
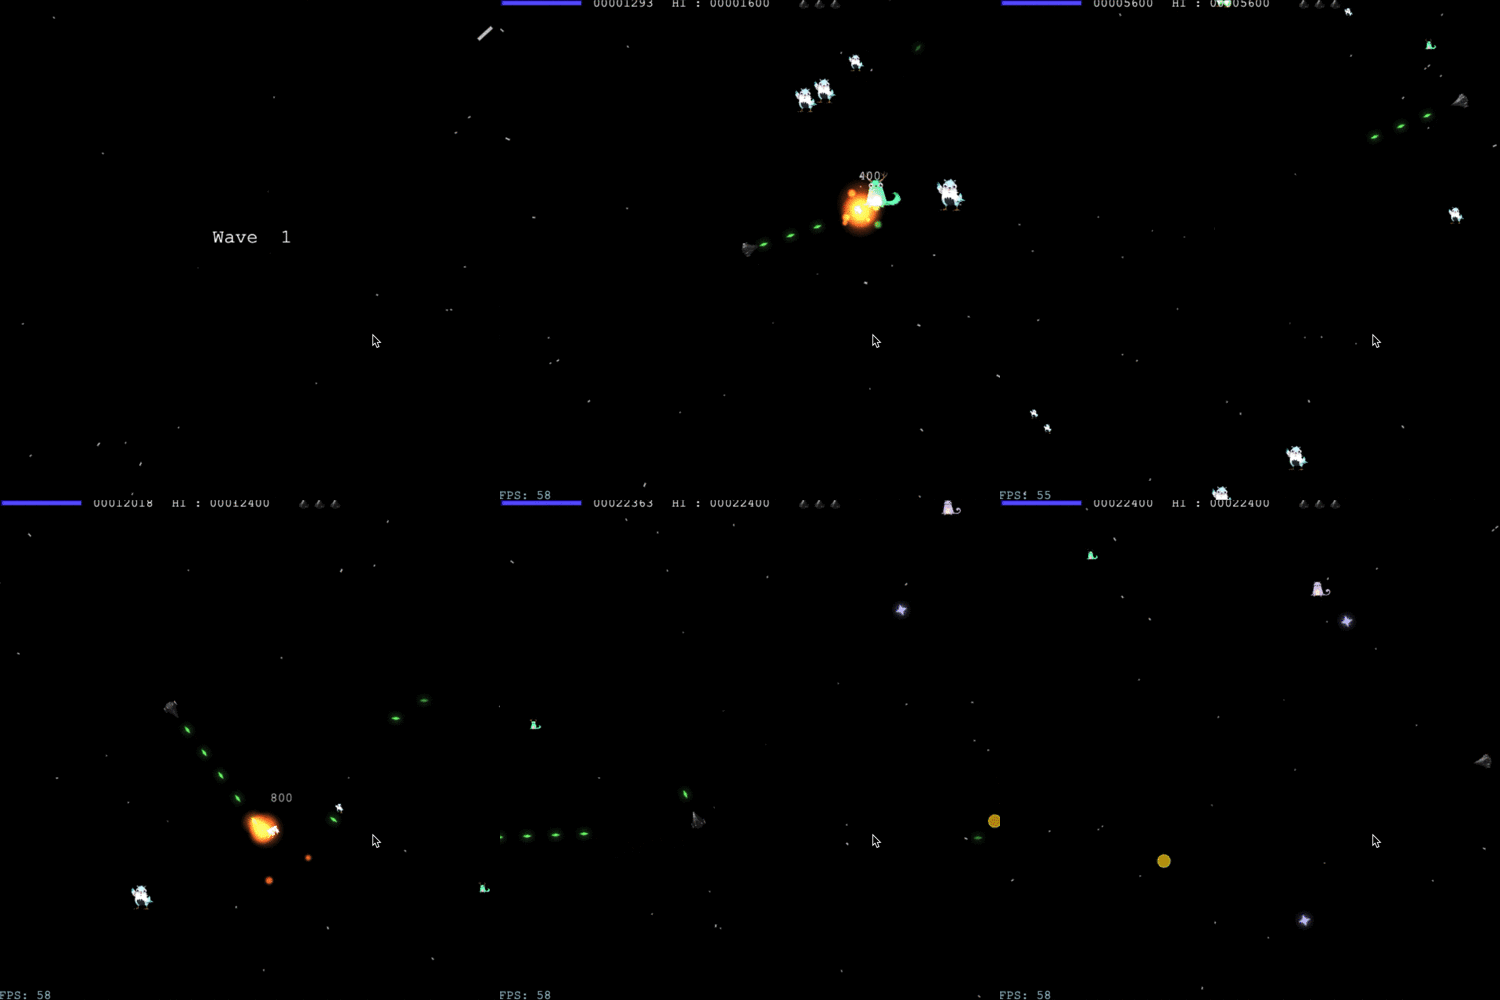
Asternifts uses the great OpenSea API to inject your NFTs into a vintage Asteroids game. Alpha version of game that will go with a broader "NFT Arcade" project.
A free interactive tool from a hobbyist for noobs to get a sense of the ETH ecosystem by visualizing it as a network of transactions.
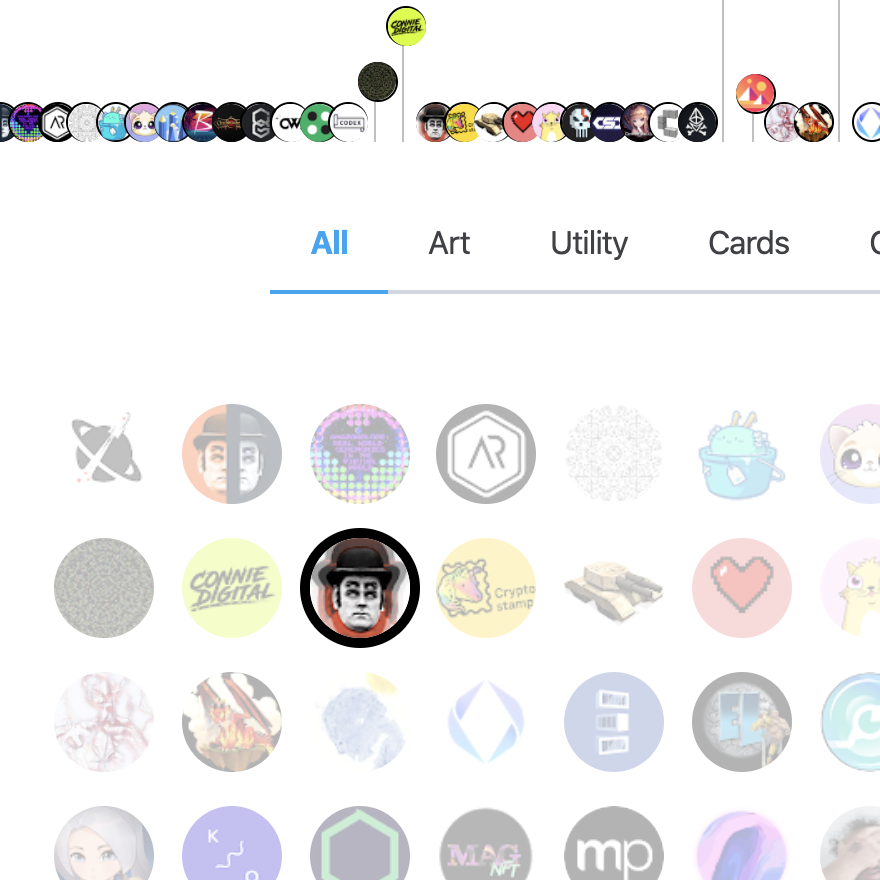
Spar is a basic NFT recommender system. Learn more. A work in progress, Spar uses statistical co-ownership patterns on the great, wide OpenSea. Results may surprise.
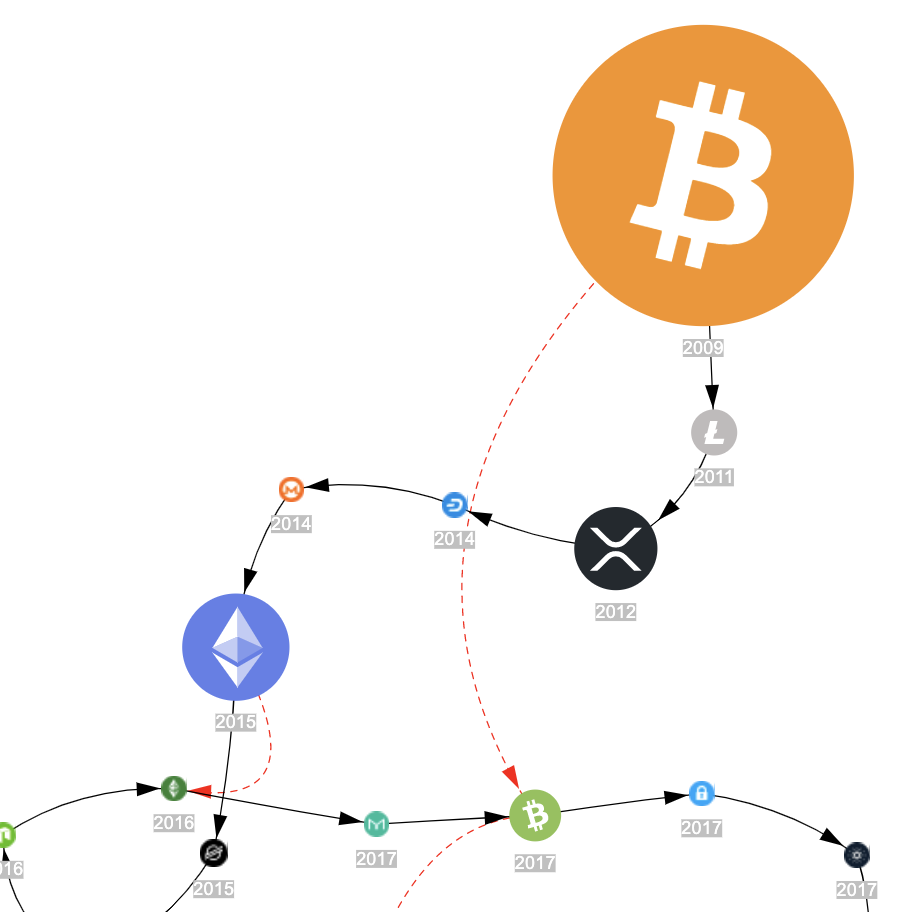
Along the graph-theoretic theme, and using Messari data, plot the history and structure of major cryptocurrencies. Adjust node sizes by common metrics, and explore the relationship among about 20 projects.
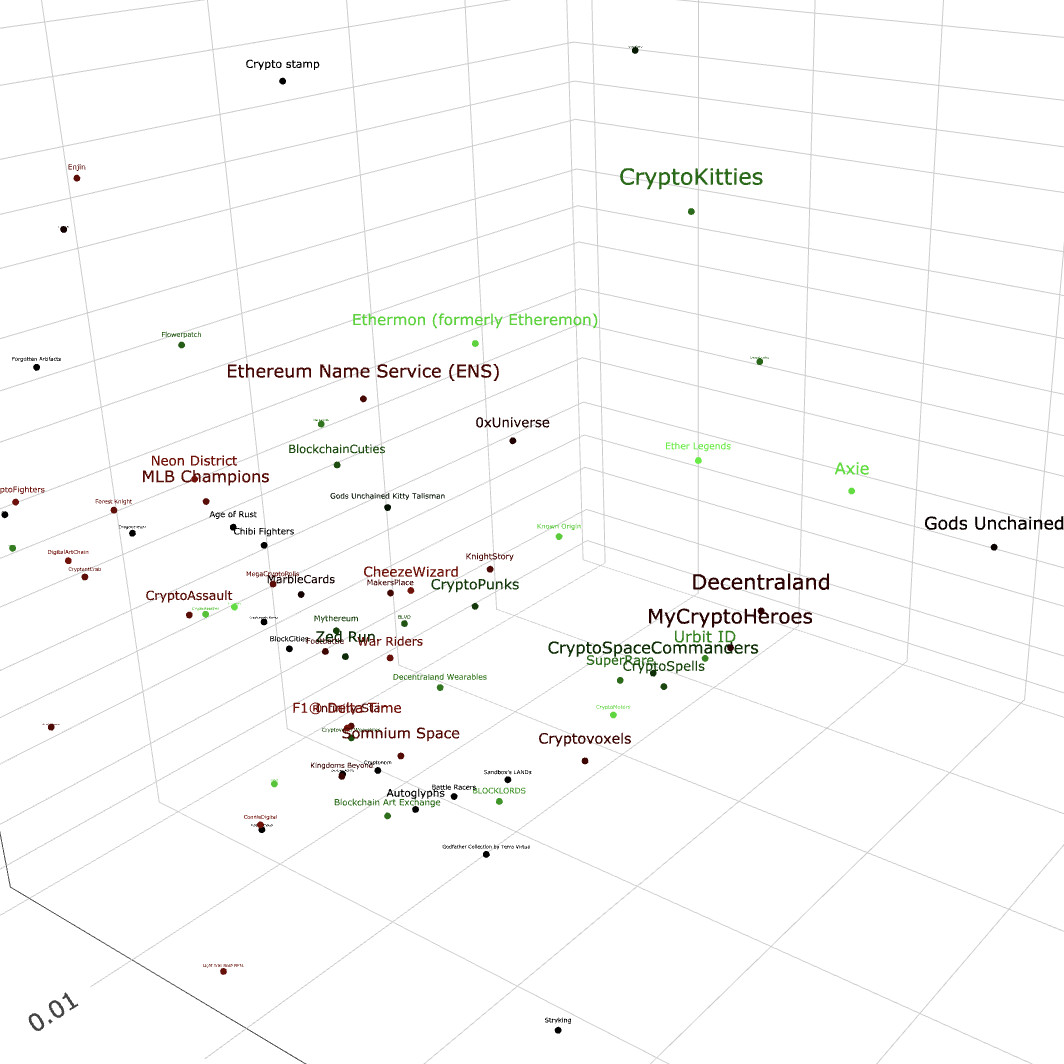
See 3D representation of NFT collections. Rotate. Explore. Click to go to OpenSea. As always thanks to amazing OpenSea API.
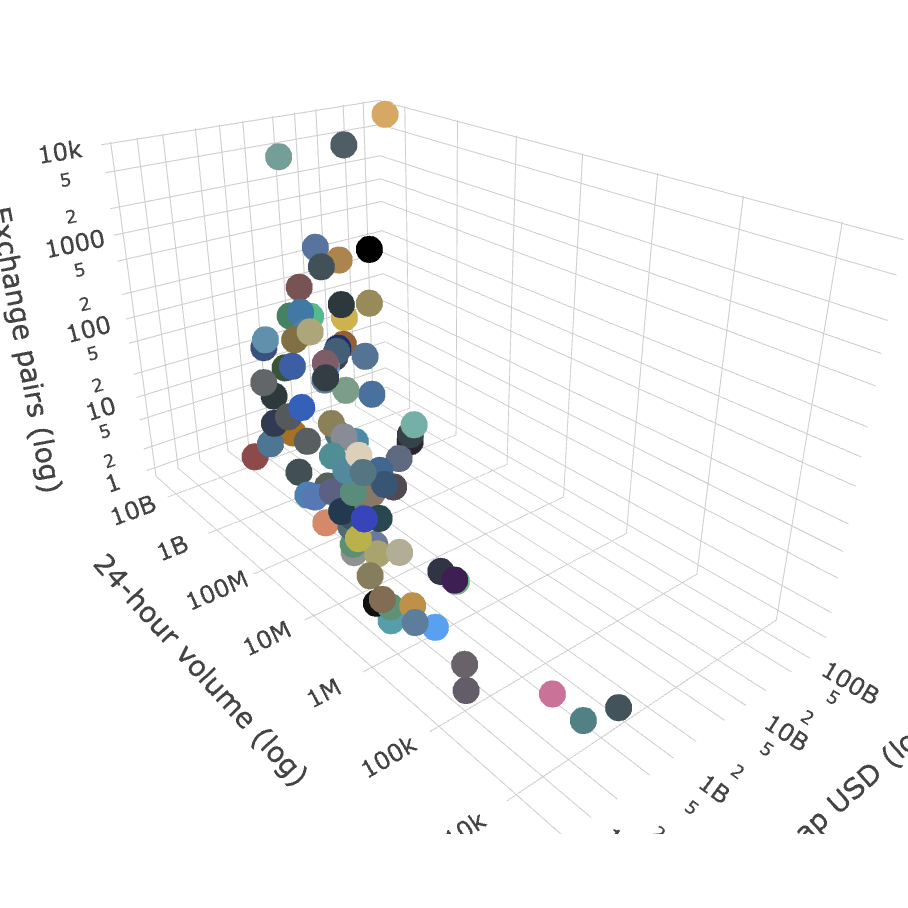
3D logarithm scatterplot of top 100 coins in fall 2019 using the very nice CoinMarketCap API. Hover to get coin details, rotate and zoom, click to see CoinMarketCap's profile. A kind of 3D "visual screener" for the basics.
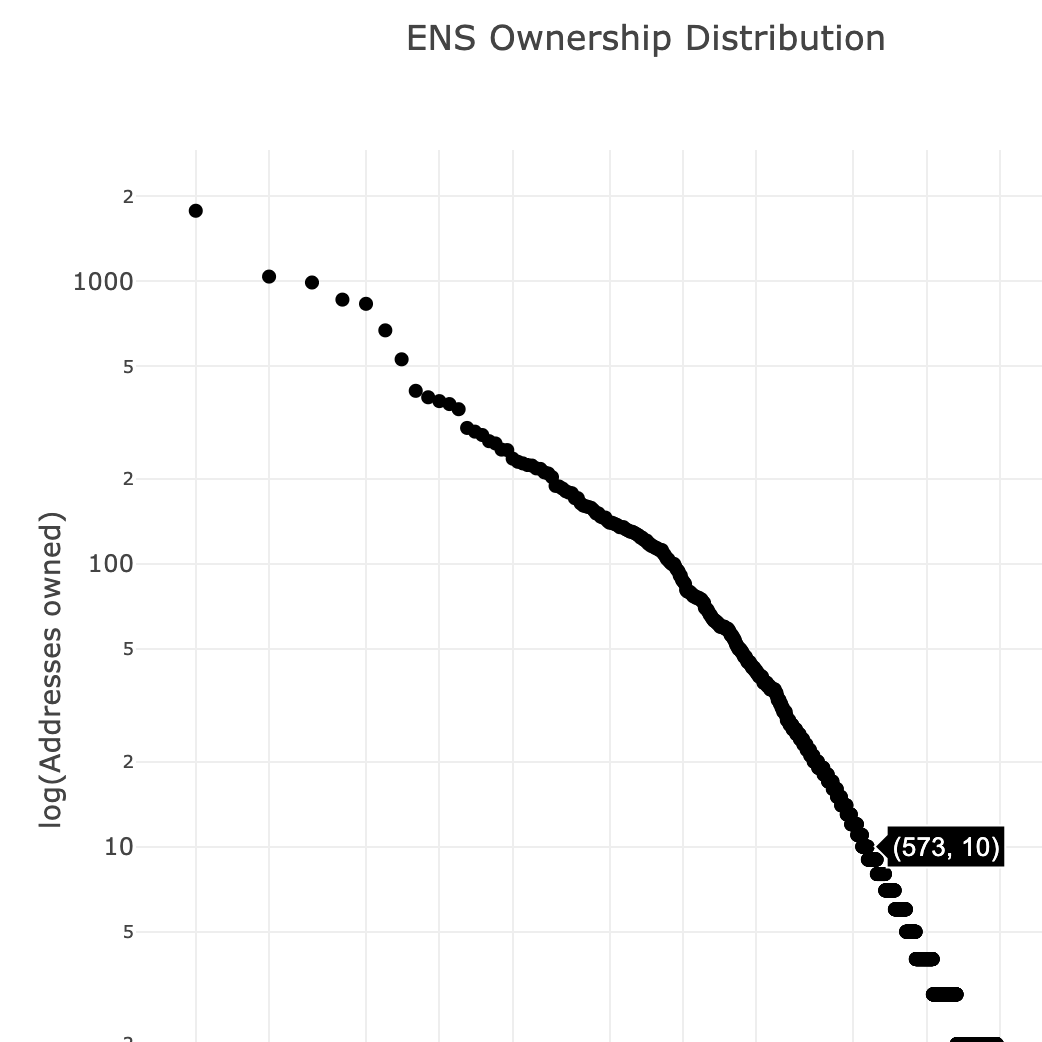
An interactive tool to explore the ownership distribution of ENS domains. See the whales and the minnows and sample .eth domains. Thanks to amazing OpenSea API. You can read about the origins of the tool on this OpenSea blog post.
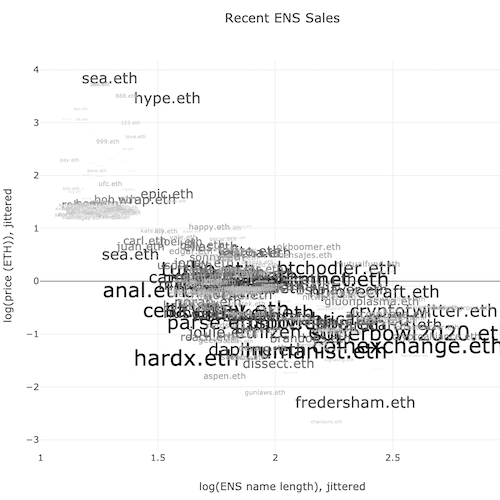
Visualize recent ENS domain registrations reported on the amazing OpenSea API. Residual value is reported for sales at each domain length in characters. Reports on the 500 most recent sales.
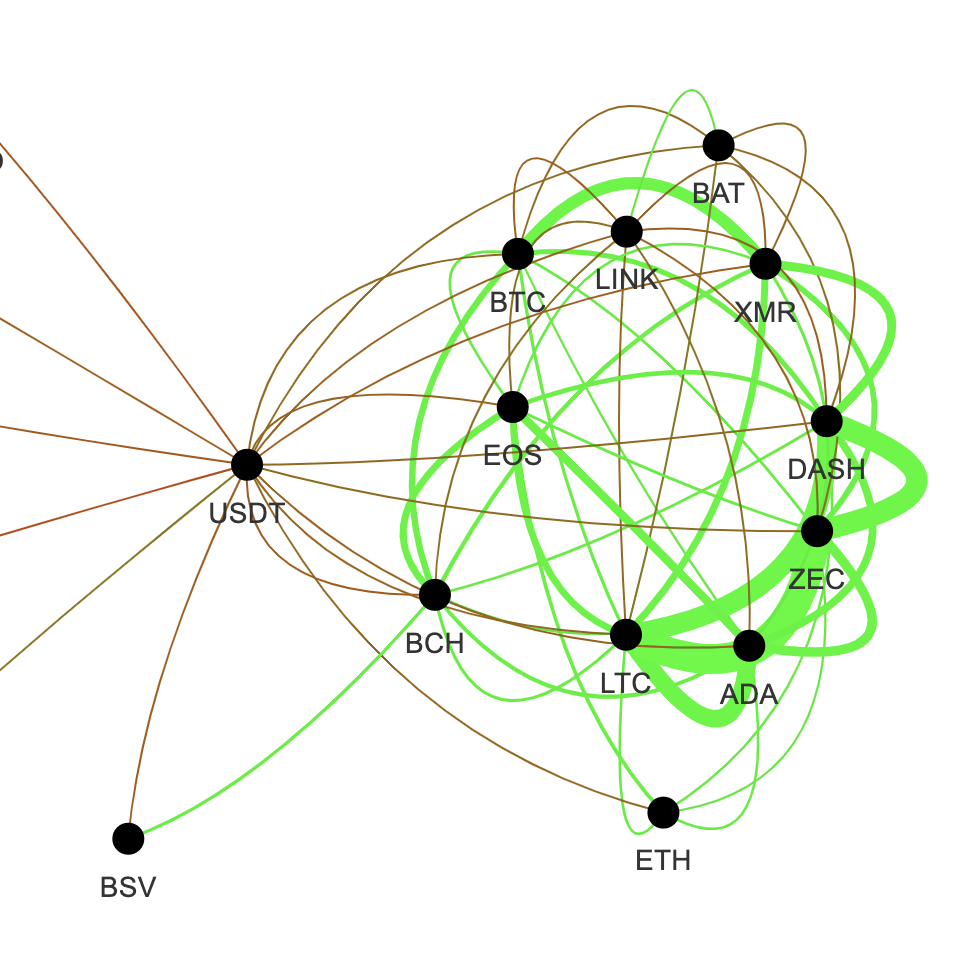
Use basic graph theory to explore the relationships among crypto projects with Coin Metrics data. A network diagram illustrates how coins are correlated across different ranges of time.
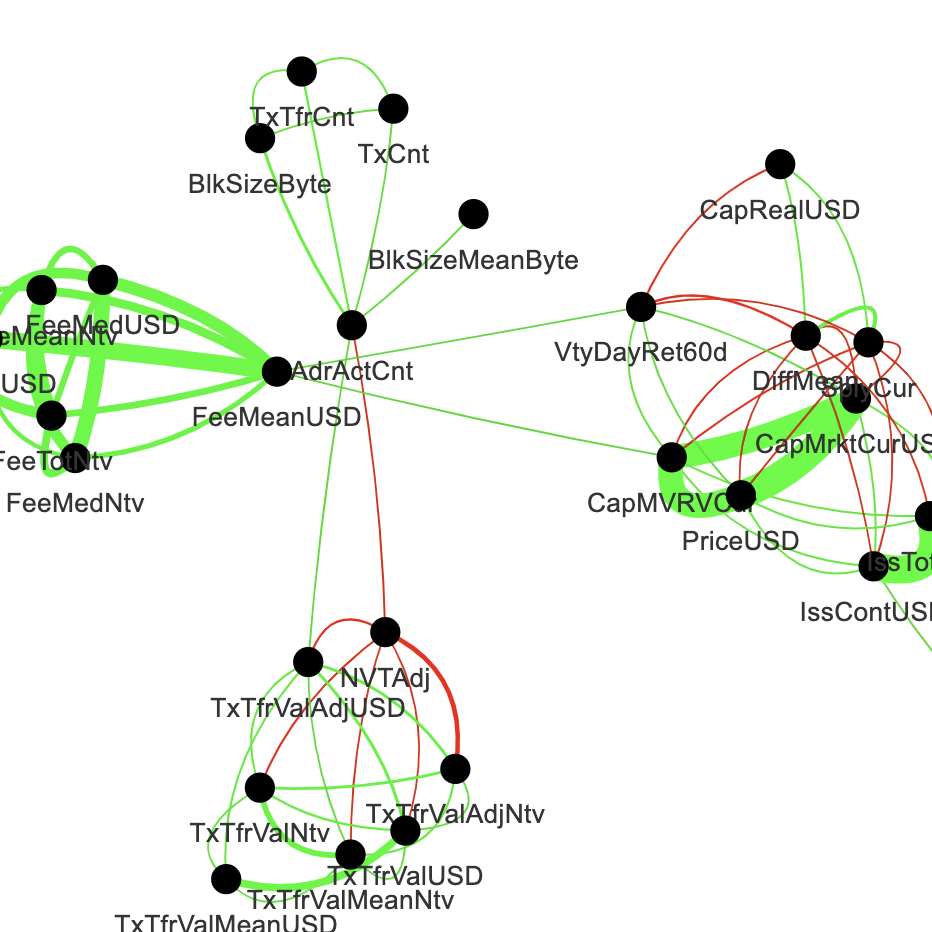
Use graph theory to learn about metrics from Coin Metrics. A network diagram lets you see how metrics are related to each other, and which measure the same properties of crypto projects. Implemented for 7 coins.
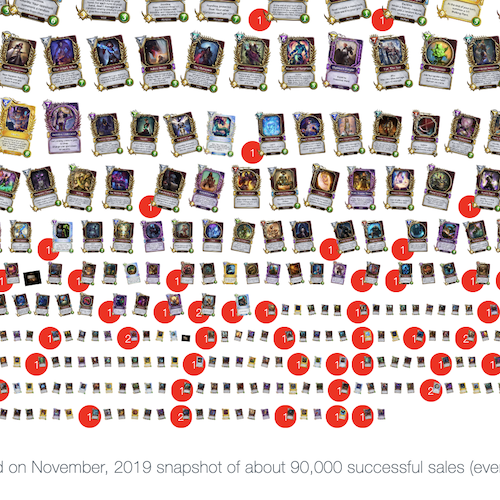
Gods Unchained! Analysis of 90,000 sales on OpenSea up to November. Also displays recent 100 card auctions so you can compare with historical prices. Thanks to amazing OpenSea API.